WidgetAI Widgets – Estimation Board, WSJF Grid, Monte Carlo Forecast, Time In State | Custom Agile
Widget 1 of 4

Estimation Board

Everyone has a backlog. Not everyone has sized it. The Estimation Board gives your team a kanban-style board where cards represent unestimated work and columns represent size values. Drag a card to the right column and the PlanEstimate field updates in Rally. That's it.

The default scale is No Estimate, XS (1 point), S (2), M (3), L (5), XL (8). You can change it. The column labels and point values are configured in the widget's settings panel, per instance.

What it does

  • →Drag-and-drop estimation: drop a card onto a column and PlanEstimate saves to Rally on release
  • →Three artifact types: Stories, Defects, and Defect Suites in a single view, each togglable
  • →Filter bar: search by name or formatted ID, filter by type or owner with multiselect chips
  • →Swim lanes: group rows by Owner, Project, or any field on the artifact
  • →Inline status toggles: flip Ready and Blocked flags directly on the card
  • →Add new: create a Story, Defect, or Defect Suite from the board, scoped to the current project

View source on GitHub →

Widget 2 of 4

WSJF Grid

SAFe teams use Weighted Shortest Job First to sequence Portfolio Items by economic value. The math is simple. Getting the inputs into Rally and keeping them updated is where the friction lives. The WSJF Grid makes that part fast.

The formula: (RR/OE Value + Business Value + Time Criticality) / Job Size = WSJF Score. The grid shows all four inputs as editable cells. Click one, type the value, and the score recalculates in place and saves back to Rally. No opening individual records, no bulk edit sidebar.

What it does

  • →Sorted by WSJF Score: Portfolio Items ranked highest to lowest, so you always see the top of your queue first
  • →Inline editing: click any of the four WSJF input cells to edit; score recalculates and saves on every change
  • →Divide-by-zero safe: items with no Job Size show a blank in the score column instead of crashing
  • →Export to CSV and Excel: one click for the thing your PI Planning spreadsheet is waiting for
  • →Feature or Epic view: settings panel lets you switch between Portfolio Item types
  • →Custom filter: narrow the list with any WSAPI query, e.g. (State = "In-Progress")

View source on GitHub →

Widget 3 of 4

Monte Carlo Forecast

Single-point estimates lie. Not because the person who made them is bad at math, but because a single date can only ever be someone's guess at P50, meaning you're late half the time by construction. Probabilistic forecasting is the honest alternative.

The Monte Carlo Forecast runs 10,000 bootstrap simulations over your team's real weekly throughput. The output isn't one date; it's a distribution: "85% chance you finish the remaining 42 items by June 6." Stakeholders get a number they can actually commit to. The P85 threshold is the standard Daniel Vacanti recommends in the forecasting community, and it's what we default to.

It answers two questions. Drop a backlog count and get a date range. Or flip the mode and drop a target date to see how much work you'll realistically complete. Both modes update in under 50ms when you change inputs.

What it does

  • →Two forecast modes: "When will it be done?" and "How many items by date X?", each running 10,000 trials
  • →Four artifact modes: Stories, Defects, Combined (stories + defects pooled), and Portfolio Items
  • →Multi-team forecasting: pool throughput from multiple Rally Projects; remove a team and the sim reruns
  • →Seven visualizations: forecast histogram, throughput run chart, percentile table, S-curve, type-mix donut, burn-up fan, and a natural language summary
  • →Confidence percentiles: P50/P70/P85/P95 bands; P85 is the Vacanti-standard commitment threshold
  • →LookbackAPI throughput: uses Rally's state-transition log to count stories exactly once, even ones that cycled back through Accepted
Widget 4 of 4

Time In State

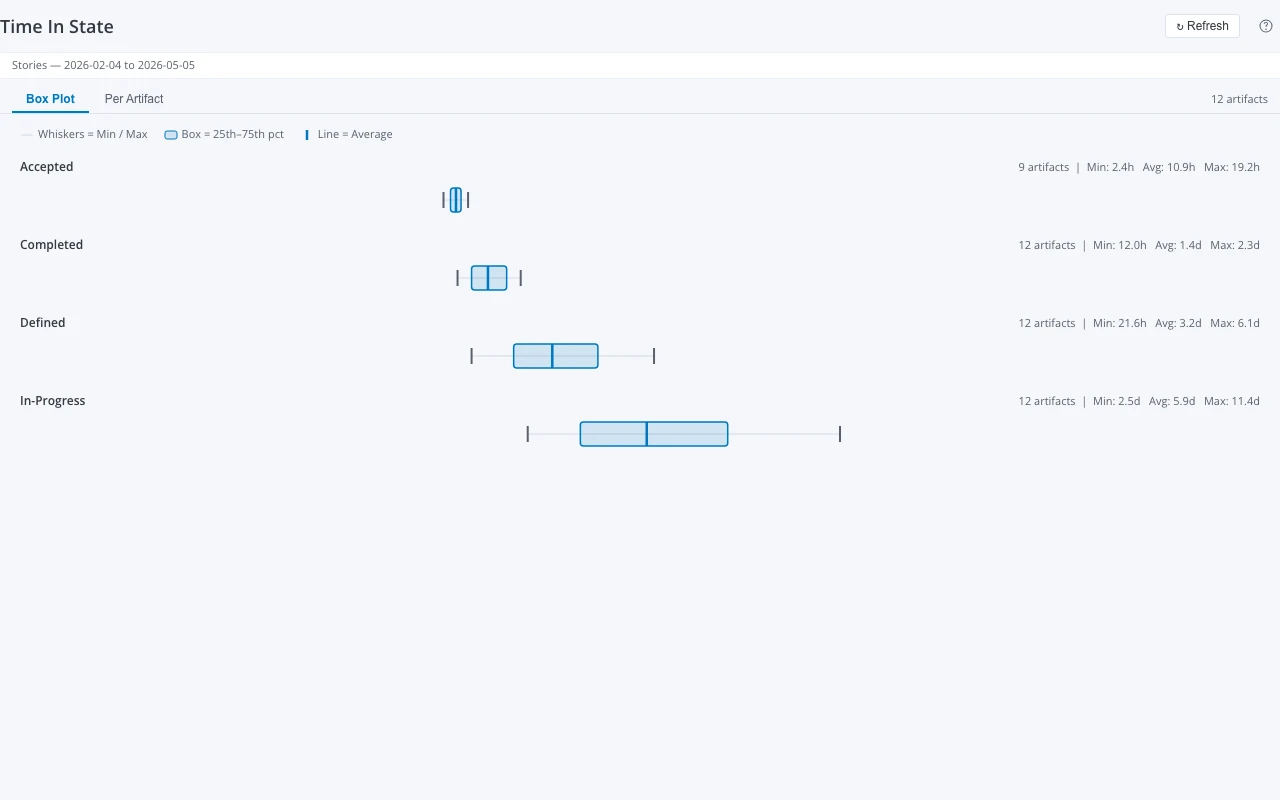
Most teams know their velocity. Few know where work actually slows down. Time In State pulls Lookback API snapshots for every artifact in scope and computes how long each one spent in each workflow state. The output isn't a list of stories. It's a distribution: min, 25th percentile, average, 75th percentile, and max days per state, visualized as a box plot.

If stories are routinely sitting in Defined for 8 days and In-Progress for 2, that's a planning problem, not an execution problem. The box plot makes that visible in seconds. The Per Artifact tab lets you drill down to see the exact timeline for any individual item.

What it does

  • →Box plot by state: min, p25, mean, p75, and max days-in-state for every workflow state, across all artifacts in scope
  • →Per artifact table: flip to a table view showing every artifact with its time in each state, linked FormattedIDs included
  • →Five artifact types: Stories, Defects, Tasks, TestCases, and Portfolio Items, all pulling from the same Lookback query pattern
  • →Configurable date window: default 90 days, adjustable from the settings panel; any range the Lookback API supports
  • →State filter: optionally narrow the box plot to specific states (e.g. "Defined, In-Progress") to focus on the part of your flow you care about
  • →Noise filtered: durations under 1 hour are discarded, so snapshot churn from same-day state transitions doesn't skew your averages

View source on GitHub →

Time In State widget showing a box plot with four workflow states (Accepted, Completed, Defined, In-Progress) with min, average, and max durations displayed per state
Getting Started

All four deploy the same way.

Each widget is a standalone npm package. Install dependencies, run the build, and deploy directly to Rally as a Custom View using the WidgetAI CLI. The same command works for all four:

npm install
npx widget-ai deploy

That builds the widget and pushes it to your Rally workspace as a new Custom View. You pick which page it lives on inside Rally's layout editor.

You can also run npm run dev to get a local preview against mock data before you touch a production workspace. All four widgets ship with seeded mock data so you can see the real interface before configuring any API keys.

Estimation Board

localhost:5847

Mock data: 14 stories across 6 estimate columns. Filter and swim lane controls active in mock mode.

WSJF Grid

localhost:5848

Mock data: 13 Portfolio Items with pre-populated WSJF inputs. Inline editing works against the mock store.

Monte Carlo Forecast

localhost:5849

Mock data: 4 teams with 12 weeks of realistic throughput. All 7 visualizations and both forecast modes are active.

Time In State

localhost:5175

Mock data: 12 stories with Lookback snapshots across 4 states. Box plot and per-artifact table both active in mock mode.

WidgetAI

The widgets come with it.

WidgetAI is the migration tool for the October 31, 2026 App SDK deadline. These four widgets are part of what you get when you work with us.